
By Eric Anderson, VP Business Intelligence
Reading Jeff Campbell’s posts on seasonality, I thought it would be useful to show some an example of how to calculate simple seasonality indices. Putting math behind any seasonality assessment allows one to:
- Show where seasonality/non-seasonality exists
- Quantify the relative magnitude of any one seasonal shift compared to others
- Provide a numerical basis or weighting for the tactical actions derived from the analysis
As Jeff’s piece points out, the basis for any seasonality assessment is data. The guiding rule is that the more data you have the better. At a minimum, any seasonality analysis requires at least a years’ worth of data (be it weekly, monthly or quarterly). This allows for the creation of a baseline that can be used to describe “how” seasonal each of the different parts of the year are. If you don’t have at least a years’ worth of data you are most certainly going to see skewed results (unless the data being assessed is inherently non-seasonal). Ideally, having data covering multiple years is necessary to get the best understanding of annual fluctuations. Unfortunately, as is often the case, the data just isn’t available or suitable, so we are forced to make do with what is available. In these cases, it’s best to consider any observations as purely directional.
Example: How Seasonal are Searches for Digital Cameras?
For this example, I am interested in understanding how consumer search volume for digital cameras changes throughout the year. (NOTE: the data that I use has been altered and does not necessarily match true annual search patterns for digital cameras). I have trended 2007 monthly search engine impression data for all terms associated with digital cameras here (click for larger images):
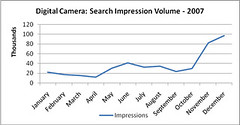
To create the indices, the first thing we have to do is calculate the average monthly impression volume for the year. To do this, add impression volume for each month of the year and then divide by the number of months.
(January ) 21,627,104 + (February) 16,950,546 + . . . . . + (December) 96,819,000 = 433,979
433,979 / 12 months = 36,165 per month average
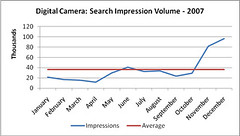
Plot this number on the chart for each month to help visualize variations month to month:
Next, on a month by month basis, calculate each month’s net difference (positive or negative) from the annual average.
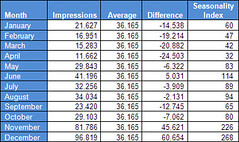
You can also calculate seasonality indices using the following formula:
Index = (Impressions / Average) *100
What can seasonality indices tell you?
These indices reveal that consumer interest in digital cameras (as measured by search engine queries for digital camera terms) surges in June to a degree but explodes during the traditional holiday buying season. Perhaps not that shocking of news, but we now have numerical data that shows to what degree, relative to the rest of the year, consumer interest in digital cameras increases during the holiday season.
If you had (for simplicity sake) $12,000 to spend on search marketing in 2008, how would you allocate that budget? You could plan to spend $1,000 each month. However, armed with this information, a better plan would be to allocate nearly half of your budget in Q4 where consumer interest is greatest and roughly half of all queries are made.
Keep in mind that I’ve made many assumptions in this analysis for the purposes of this example. This analysis doesn’t take into consideration what happened in 2006, 2005, 2004, etc., competitive actions, the market for digital cameras over time and many other things. In short, it assumes that 2007 search engine impression data represents typical consumer interest in digital cameras which may or may not be accurate.
Optimally, using impression data from prior years increases confidence in the reliability of seasonal indices. By looking at the average monthly impression volume for each month across a range of years (e.g. 2003, 2004, 2005, 2006, and 2007), not only can a better picture of individual month seasonality be constructed, but standard deviations for impression volumes for each month can be calculated showing how variable impression volumes are year to year for a given month and is useful in developing forecasts. Forecasts, however, are a topic for another day.
Lastly, I’ve used impression data in this example. However, for search marketers, this may only be the beginning. Understanding the seasonality of clicks, conversions, CPCs, etc. is also important to paining a complete picture of how consumers interact with your category, brand, and websites over the seasons. There are more sophisticated techniques than what I’ve demonstrated here, but this simple method is a great way to uncover meaningful insights quickly.


0 comments:
Post a Comment